

How to read a stock chart
How to read a stock chart
Getting to grips with the core aspects of a stock chart

I can vividly remember a time when I knew nothing about equities. None whatsoever. And I was firmly in the 'that's for other people, not for me' camp.
The stock market gets a terrible rap, and I'm not here to debate the merits of the stock market itself, but I do want you to overcome the fear that you might have of not understanding how it all works, so that IF you ever decide to invest in shares, you can do so with the confidence that you understand how it works.
I'm not going to be able to cover everything about stocks in one newsletter, but let's start with 'how to read a stock chart' and go from there.
What does a stock chart even look like?
👇 is an example stock chart showing Amazon’s stock:
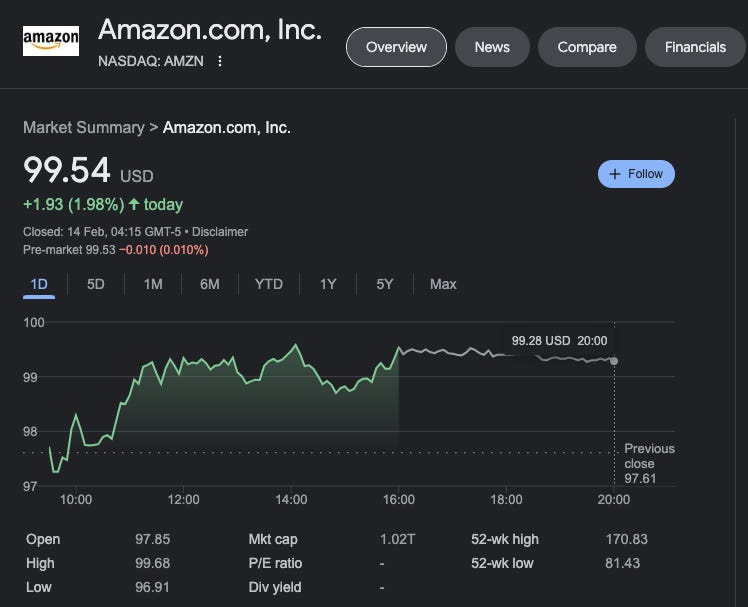
(Quickly) explained…
What’s the purpose of a stock chart?
Stock charts are graphs that show the performance of a company's publicly traded shares. You can assess performance over days or years, i.e. whether the share price is rising, falling or flat.
🧱 Core components of a stock chart:
Price: at the very top of the chart you’ll see a price - that’s the current price of one individual stock - right below the price you’ll see a % - this is the % amount that the stock has increased or decreased during that given day
Open: What price the stock was at when the market opened for the day
High: The highest price the stock has reached for the day
Low: The lowest price of the stock for the day
Mkt cap (market capitalisation): The total value of all shares in the company owned by shareholders.
P/E ratio (price/earnings ratio): A ratio of the company's share price to the company's earnings per share.
52-week high: The highest price at which the share has traded in the previous 52 weeks.
52-week low: The lowest price at which the stock has traded in the previous 52 weeks
Dividend yield: A percentage showing how much of the company's share price it pays out in dividends to shareholders each year (not every company will have a dividend yield).
Extra pieces to know 🧩
At the top of the stock chart, you’ll see timeframes i.e. 1D (1 day), 5D (5 days), YTD (year to date) etc. When you toggle on any of these you’ll see the chart that represents that time period. So for example, if you toggle on YTD (year to date), then you’ll be presented with a graph which shows how the stock has performed over the year so far.
Every stock is listed on an exchange and each stock has a stock ticker - like the one above. In this instance you’ll see the exchange is Nasdaq. The two big U.S. exchanges are the NYSE and the Nasdaq. In the UK, the big one is the London stock exchange.
Then there’s the “Ticker Symbol” which is a unique one to five letter code used by the stock exchanges to identify a company. In the above example, using Amazon, the ticker symbol is AMZN. You can find thousands of them here.
📈 Stock charts explained…in 01:10 mins

There will be many more stock market related concepts to understand, but hopefully this was a good start 💪🏽
Thanks for reading and I really hope you learnt something from this - always love to hear feedback, so just hit the reply button to share your thoughts!